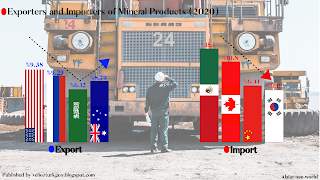
Englısh etiketine sahip kayıtlar gösteriliyor. Tüm kayıtları göster

Epithermal Gold Deposits & Epitermal Altın Yatakları | Vol2

Epithermal gold deposits have alteration, geometric shapes. Alteration is a very important thing when searching for epithermal gold deposits. They have clay and silicic zones. We can find Antimuan minerals ıf they including gold and silver. Epithermal gold deposits can include Pb, Zn, and Cu minerals but these minerals tenor is very low (1/100).

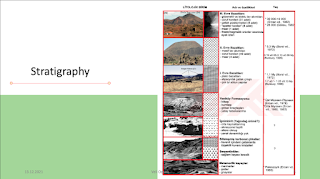
Erosion size is an important thing for the field survey.

If there is no erosion in the field you can see:
-Silicic Zones
-Hydrothermal breccia

If there is an erosion in the field you can see:
-Carbonate massive vein or clay solution
-hydraulic breccia
-cryptocrystalline bands
- Quartz which has calcite

Mine deposits were classified by Lindgren. According to Lindgren, this classification has three-part. The first part is from surface to 1km depth. It's well known as epithermal. And the second part is Mezothermal ( to 3 km). The last piece is Hypothermal (to 15km).


After the Lindgren, mine deposits were classified as formation environments and wall rock types.

-Epithermal deposits with magmatic rocks
-Epithermal deposits with sedimentary rocks (Carlin Type)
-Epithermal deposits with ultramafic rocks

1. Magmatic rocks and epithermal deposits 
This activity occurs in convergent plate zones. The rock compound is calc-alkaline (Rich Ca). This field is controlled by a structural process.

2. Carbonate rocks and epithermal deposits (Sedimentary)
As, Sb, Hg, and TI are very common, and also Carlin-type deposits occur in this area. The Calcite dissolve where low-temperature carbonate rocks. Then Au and pyrite occur. Au/Ag rate is more than 1 and temperature is lower than 250°C.

3. Ultramafic rocks and epithermal deposits
These rocks have carbonate and silica. These materials are dissolved with a geothermal solution. And they take a name as Listwenit. Co, Ni, Hg and Au are prevalent with Listwenit.

Article link


Epithermal Gold Deposits & Epitermal Altın Yatakları

"Epithermal gold deposits have size, geometry, ore-type, and grade variations that can be broadly organized around some genetic classes and, therefore, influence the exploration approach or philosophy.

Lindgren concluded that ore deposition occurs because focused, rapidly ascending fluids quickly change composition within a kilometer or so of the surface. We now know that this change is caused by boiling, the process that most favors precipitation of bisulfide-complexed metals such as gold. Boiling and the concomitant rapid cooling also result in many related features, such as gangue- mineral deposition of quartz with a colloform texture, adularia and bladed calcite, and die formation of steam-heated.

The high-sulfidation deposits, by contrast, are characterized by enargite-luzonite- covellite plus pyrite assemblages.

The higher pressure will also contribute to the likelihood of hydraulic fracturing, hydrothermal brecciation, and possible hydrothermal eruption, such as has occurred in the geothermal systems of Yellowstone, Wyoming, and Waiotapu and Waimangu, New Zealand.

Low-sulfidation deposits are affiliated with a wide range of rock types, from alkalic to calc-alkalic.

Gold ore in low-sulfidation deposits is commonly associated with quartz and adularia plus calcite or sericite as the major gangue minerals."

Article link : Exploration for Epithermal Gold Deposits JEFFREY W. HEDENQUIST


Epitermal Altın Yatakları Epitermal altın yatakları boyutları, geometrisi, cevher tipi ve oluşum dereceleri bakımından bazı sınıflandırılmalara tabi tutulmuştur. Örneğin ekonomik açısından önemli olan Yüksek Sülfidasyon Yatakları ve Düşük Sülfidasyon yatakları sermaye maliyeti açısından düşük ve açık maden yataklarıdır. Aksine Düşük Sülfidasyon damar tipi yatakları (yapısal olarak kontrol edilen) yer altı madenciliği için maliyetli ve çevresel etkileri olan yataklardır. Ek olarak, orta dereceli yüksek sülfidasyon yatakları oksitlenmedikleri süreci karmaşık metalurjik yapıları ve yüksek arsenik içerikleri nedeniyle ekonomik olarak uygun olma eğilimindedir.

Epitermal Sistemler ayrıca geniş ölçüde metal ve mineral çıkarımının yapıldığı yataklardır. Hg(civa), Sb(antimon), S(kükürt), kaolinit, alunit ve silika bunlara örnektir. Maksimum formasyon derinliği Lindgren’e göre yaklaşık 1km’dir. Yine Lindgren’e göre hızlı yükselen bir akışkanın bileşiminin ortamın sıcaklığı nedeniyle (boiling nedeniyle) hızlı değişebileceği vurgulanmaktadır. Kimyasal bileşimdeki bu hızlı değişim (kaynama ve hızlı soğuma) gang minerali, adularya ve kalsit gibi minerallerin oluşumuna yol açmaktadır.

Epitermal yataklarda düşük sülfidasyon ile yüksek sülfidasyon sonucunda farklı mineraller ve cevherleşmeler meydana gelmektedir. Yüksek sülfidasyon yatakları Enarjit(sülfür-bakır içeren bir mineral),Luzonit(bakır minerali), Kovellenit ve pirit toplulukları tarafından karakterize edilirler. Düşük sülfidasyon yatakları ise alkalik ile kalk-alkalin arasındaki kayaçlar ile karakteri olurlar. Bu yataklardaki altın cevherleşmeleri kuvars, adularya, kalsit, serizit ve gang mineralleri ile karakterize edilebilirler. End-Member düşük sülfidasyon yatakları Zn-Pb gibi element içerebilirler.

Makale Linki: Exploration for Epithermal Gold Deposits JEFFREY W. HEDENQUIST

Who is James Webb & What is the James Webb Space Telescope

Actually, his full name is James Edwin Webb. He conducted NASA between 1961 and 1968. And now, his name is given to a telescope which gonna observe to space. 


But what is the James Webb Space Telescope? Everything was started with Next Generation Space Telescope project(NGST) in 1996. Nasa decided to send a telescope to space that was bigger than Hubble (was sent in 1990). 


But what is the difference between Hubble and this telescope? James Webb Space Telescope will take the place of Hubble. It can observe 13.5 billion year distances. Actually, this number is bigger than Hubble. And this project will help us to recognize where are we in the universe. James Webb Space Telescope has bigger mirrors than Hubble. The telescope is almost 85000 miles away from the Earth when ı write this text. (You can follow where is the rocket). 

It's gonna be orbit to L2 29 days later. Scientists are hoping to discover new planets, new galaxies, and new features of planets with help of telescope.


Comparison of Remote Sensing Methods

Remote sensing is the most popular analytic software for 10 years. A lot of software was developed in remote sensing area. Such as ArcGIS, Erdas, Idrisi Selva, Map Viewer... But which software is most beneficial and utilizes?

I've chosen an area ( west of the Turkey-Kula volcanic area) in Turkey. Then I downloaded tiff data from USGS servers. But which programme was gonna gave true analytic results?

Arcgıs Supervised Classfication

ArcGıs Unsupervised Classification

First of all, I started with Idrisi Selva. There was a very low difference between supervised and unsupervised classification. Second, I calculated the same area with Erdas Imagine. The difference was very low but more than Idrisi. And finally, I calculated the same analyses with ArcGIS Pro which is my favourite software. I use this programme almost for 2 years. I've created a lot of thematic maps, geological maps, fault maps, mineral analyses with it. But the result was bad for me. Supervised Classification and unsupervised classification result were more than other. There was a very high difference between the two classifications.

In my opinion, Idrisi selva gives always the best classification result. ArcGIS and Erdas Imagine are very beneficial for mineral analyses and to create new maps.

Stay Safe

Remote Sensing and Minerals | Vol1 | Spodumene

Remote sensing is a very easy, cheap, practical, and common method for analysis. Remote sensing methods are developed with technological advances. Today we gonna talk about how we can create a mineral map via remote sensing!


First of all, we'll create a Spodumene map. Such as Australia has big Spodumene deposits. ( West Of Australia-Wodgina Mine).

We need satellite images like Band 3 and Band 5. Then, follow these steps!

1. Open Bands in ArcGIS
2.GeoSpatial Analytics Tools-----> Map Algebra
3. Select Band 3 / Band 5 and save, RUN!

You'll have a Spodumene Map!


Porphyry Deposits and Re-Os Dating

Porphyry is a special mine deposit that includes Cu, Au, and Mo elements. According to researchers, 75 percent Cu, 20 percent Au, 95 percent Mo production provides from Porphyry deposits. We know that these deposits reach out from the Alps to Iran.

jamstec.go.jp (More info : Article)

Companies research these deposits with the Re-Os dating method. Re-Os dating gives geochemistry analyses, mine analyses, mantle and crust relations, and sea-water analyses. Rhenium ( atomic number-75) and Osmium ( atomic number-76) move from seawater to sediments which is anoxic and then builds up. Rhenium and Osmium show positive trends against Organic Carbon. Re-Os dating is a beneficial method because the error margin is usually very minimal.

Stay Safe

The Cretaceous–Paleogene Extinction and Timeline of Extinction Event Research

The Cretaceous-Paleogene (K-Pg) extinction was huge elimination of some 80% of the fauna and flora around 66 ma. The meteor effect was hellishness. Meteor wide is almost 15 km and depth is 12 km. It was an of the five big extinctions.
Map showing positions and coastlines of Cretaceous landmasses

phys.org

There are many K-Pg boundaries in the world. Such as the US, Canada, and Spain.But how researchers investigated this boundary?

1820: Georges Cuvier realized that significant changes to Earth's animals and plant life occurred between the Mesozoic and the Cenozoic eras.

1831: Mantell declared the Mesozoic era to be the Age of Reptiles.

1842: Sir Richard Owen proposed that the major reptile groups of the Mesozoic were driven extinct as the oxygen contents of Earth's Atmosphere rose to levels better suited for birds and mammals.

1854: Charles Darwin published On the Origin of Species. He regarded the extinction of most taxonomic groups as occurring gradually through the piecemeal loss of member species. However, he considered the extinction of the ammonites at the end of the Mesozoic to have been "wonderfully sudden".

1882 : Othniel Charles Marsh interpreted the extinction of the dinosaurs as a gradual decline over the course of the Cretaceous.

1898: Arthur Smith Woodward also advocated that the dinosaurs gradually declined into extinction late in the Mesozoic.

Compilation of 105 terrestrial K-Pg boundary sections

1917: Franz Nopcsa suggested that dinosaurs may have developed overactive pituitary glands that led them to become pathologically gigantic in an evolutionary parallel to acromegaly in modern humans. 

1925: Paleobotanist George Wieland hypothesized that Tyrannosaurus rex survived on a diet of eggs
L. Müller proposed that volcanic eruptions drove the dinosaurs extinct.

1928: H. T. Marshall suggested that bombardment from cosmic or ultraviolet radiation caused the extinction of the dinosaurs.

1946: Edwin Harris Colbert and others proposed that the dinosaurs went extinct when Earth's climate became too hot and dry to support them.

1949: M. Wilfarth argued that dinosaurs were marine animals and were driven extinct by decreasing sea levels during the Late Cretaceous, which dried out their habitats.

1950: Petroleos Mexicanos, also known as PEMEX, discovered an unusual subsurface circular structure in the Yucatan Peninsula of Mexico.

1960: PEMEX began drilling into the unusual ring-like structure under the Yucatan and extracting rock cores in search of oil.

1967 : J. M. Cys argued that dinosaurs went extinct because they were unable to hibernate during the winter, leaving them doomed by Earth's changing climate.

1970: PEMEX continued looking for oil deposits associated with a large circular structure in the Yucatan Peninsula.

1971: D. A. Russel and Tucker proposed that a nearby supernova emitted a burst of electromagnetic radiations and cosmic rays that killed off the dinosaurs.

1973: Harold Urey argued that comet impacts may have caused mass extinctions in the past and may have been responsible for demarcating the periods of the geologic time scale.

1974: Jan Smit began studying the extinction of foraminifera at the K–T boundary in Caravaca, Spain. He observed that some of these extinctions must have been rapid.

1977 : Alvarez and others[who?] published their research on the magnetic reversals of the Cretaceous-Tertiary boundary interval recorded in the rocks at Gubbio, Italy. They proposed that these rocks be regarded as the standard to which other rocks thought to be of this age are compared.
Spring: Jan Smit sent 100 rock samples from the K–T boundary at Caravaca to a laboratory in Delft for compositional analysis. The results uncovered high levels of metals like antimony, chromium, cobalt, nickel, and selenium. These unusual findings led Smit to suspect that the mass extinction at the end of the Cretaceous may have had an extraterrestrial cause.

Robert T. Bakker argued that Earth's terrain flattened out during the Late Cretaceous, reducing the area of the dinosaurs' preferred habitats and helping to drive them to extinction.

1978: Cloudsley-Thompson suggested that if dinosaurs were warm-blooded, increasing temperatures could have caused them to overheat and driven them extinct.

1980: Alvarez and others reported spikes in the level of platinum group metals like iridium at the Cretaceous-Tertiary boundary in Italy, Denmark, and New Zealand. They interpreted this sudden introduction of rare-earth metals as evidence for an asteroid impact, to which they attributed the mass extinction at the end of the Cretaceous Period.

1990: The Chicxulub Crater in Mexico's Yucatan Peninsula was rediscovered.

1991: Hildebrand and Boynton declared the Chicxulub Crater to be the result of the impact that triggered the mass extinction at the end of the Cretaceous. Hildebrand and others estimated the diameter of the Chicxulub Crater at 170 kilometers.

1992: Sigurdsson and others concluded that global mean temperatures dropped 2–3 degrees Celsius across the Cretaceous-Tertiary boundary.

1993: Lecuyer and others concluded that mean temperatures in some areas dropped as much as 8 degrees celsius following the Cretaceous.

1994: Smith and others concluded that the Late Cretaceous drop in sea levels constituted the most severe marine regression of the entire Mesozoic Era.

1998: Lopez-Martinez and others noted the presence of sauropod and ornithopod tracks near the K–T boundary in the Tremp Formation of northeastern Spain. The presence of tracks so close to the Cretaceous-Tertiary suggests that the dinosaur died out rapidly rather than gradually.
Sullivan argued that dinosaur biodiversity experienced a marked decline over the last ten million years of the Cretaceous Period. Stromberg and others reported that fossil pollen from the Hell Creek Formation provided evidence for a gradual shift in the region's flora "from more open to more closed and moist habitats".

1999: Norris and others concluded that the extinction of many foraminiferas at the end of the Cretaceous was abrupt rather than gradual. (More info : Wikipedia)

We have a lot of information about this extinction. I have no idea how many articles have included this topic but we can visualize how this extinction occurred over time.

Stay Safe